Getting started with Procmon: The Beginner’s Guide to Monitoring Windows Systems
Process Monitor is probably one of the most used tools by IT Pros to debug applications and check installations. We mentioned Process Monitor in our MSI Packaging Training free e-book but this time around, we want to explore it further. We will discuss its prerequisites and share how you can get started with it.
Let’s dive in!
What is Process Monitor?
Process Monitor is a Windows system monitoring tool that shows files, accessed registry keys, and active processes. A long list of improvements are also added, including process monitoring, monitoring of files loaded into system memory, improved filters, process activity details, and more.
You can use Process Monitor to track system and application activity and troubleshoot some product issues. It is particularly helpful when you need to track which application or process accesses a file or a registry key.
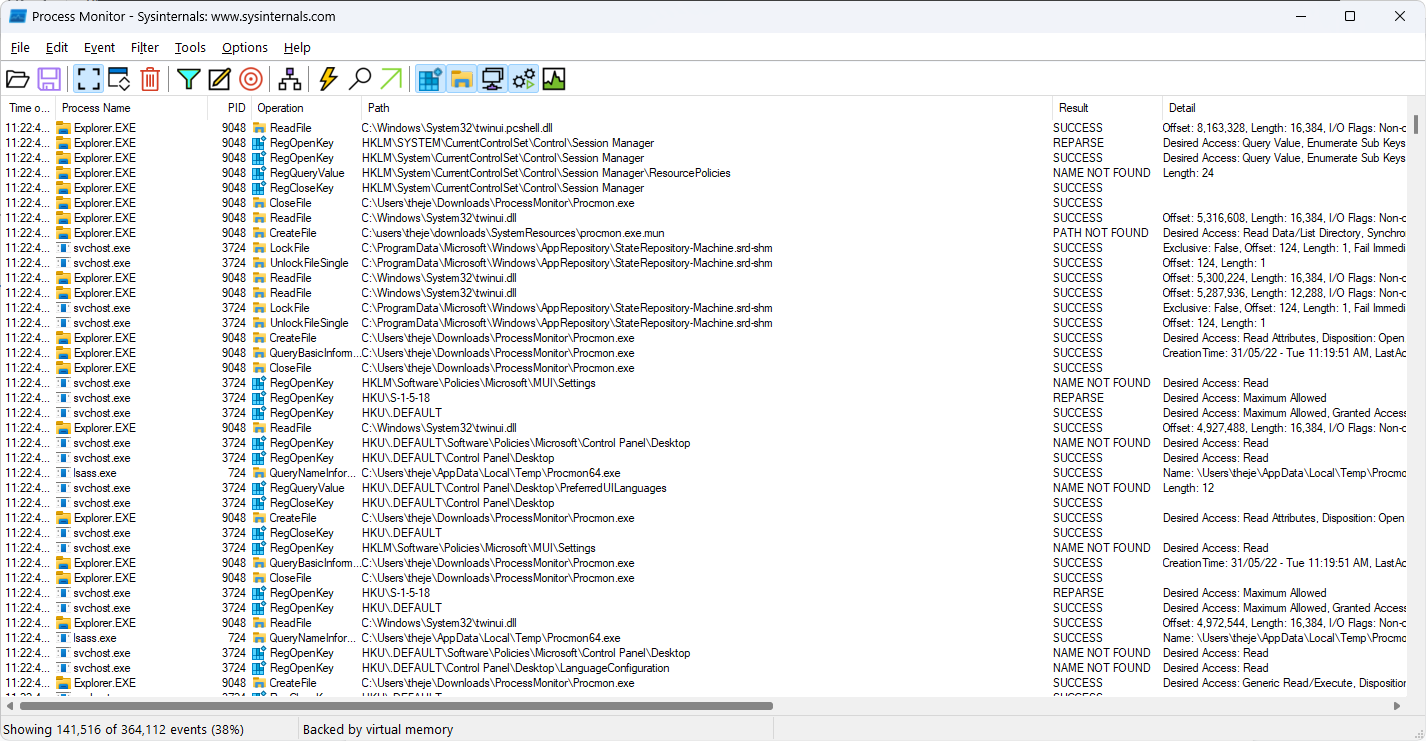
In the main Process Monitor window, we see a list of all system operations along with their exact time, process name, ID, and the result of every operation:
What are the Prerequisites to Install Process Monitor?
The best part of Process Monitor is that you don’t need any fancy prerequisites to be installed on the system, like Visual C++ redistributables or specific .NET Framework versions.
All you need to run this tool is a Windows Vista, Windows Server 2008 or higher machine (x86 or x64). And that's it, just download the tool, extract it, and run it on your Windows machine.
How to Download Process Monitor?
Downloading Process Monitor is quite easy: a simple Google search will bring you to the Microsoft docs. There, you can find the official link from Sysinternals to download Process Monitor.
As previously mentioned, you don’t need to install Process Monitor, all you need to do is to extract the ZIP file which you just downloaded.
The extracted zip file should contain the following files:
- Procmon.chm - The help file which contains all of the provided documentation
- Procmon.exe - The main EXE that will launch the correct procmon instance (x86 or x64)
- Procmon64.exe - The x64 procmon binary
- Procmon64a.exe - The alpha 64 procmon binary
- Eula.txt - The license agreement you’ll have to accept before running Procmon
Once you extract all the files and execute the Procmon.exe, Process Monitor should start immediately and you will see all the processes in detail.
Always make sure you run Procmon with elevated permissions.
How to Define Start Behavior in Process Monitor?
Process Monitor does not have many settings to configure start behavior. However, it provides little functionality in this area. For instance, if you want to start Procmon minimized, all you need to do is run this command:
Process Monitor does not have many settings to configure its start behavior. However, you have a few commands:
If you want to start Procmon minimized, all you need to do is run this command:
procmon.exe /Minimized
If you don’t want to see the EULA on the first run, you could use the following command:
procmon.exe /AcceptEula
As previously mentioned, the Procmon.exe automatically detects if your machine is running on X86 or X64. So, if you are using an X64 machine, Procmon.exe will launch the correct X64 instance.
There might be cases where you want to open up the X86 on X64 (for example reading a log which is made with an X86 procmon) and in that case you could use the following command line:
procmon.exe /Run32
If you don’t want Procmon to automatically start capturing the system events, you could use the following command:
procmon.exe /NoConnect
Procmon at a first glance
If this is the first time you are using Procmon, it can be overwhelming to see all the information that will appear on your screen.
Launching Procmon without any custom start behavior means that you will see a heavily populated list of processes that are captured on your main screen.

Since there is a lot of information presented by Procmon, let's review what each process means.
Every single event logged by Procmon is represented in a list made of seven columns:
- Time of day - The exact time when the particular event happened (down to the millisecond)
- Process name - The name of the process
- PID - The process identifier
- Operation - The type of event defined by a class (check below)
- Path - The path to the object that interacted with the event (eg: registry, file, etc)
- Result - Various outcomes indicating the result of the event: SUCCESS, NAME NOT FOUND, etc
- Detail - The full details of the operation performed
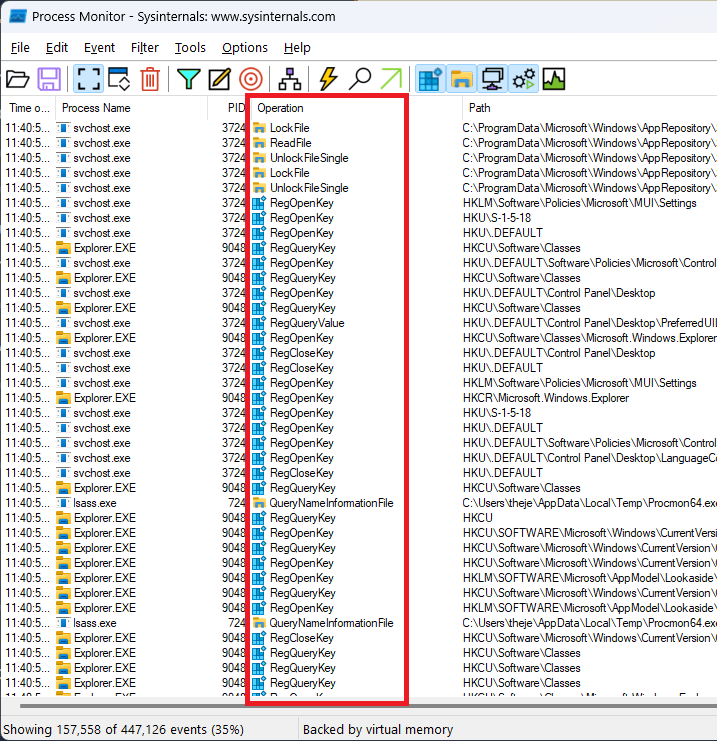
Under the Operation column, there are various icons representing different classes of Windows events, such as:
- Registry
- Filesystem
- Network
- Processes
- Profiling events
You can adjust the Procmon columns to show just the amount of information you need, so if you right-click a column name and choose “Select columns”, the following window will appear:
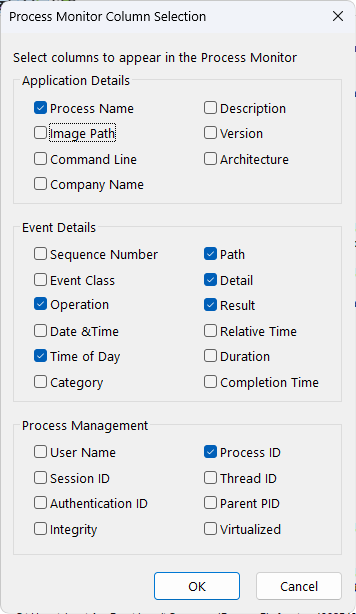
In my experience, the default setup provides all the necessary information for debugging your application or processes on the system - other options are rarely used in the IT Pro industry.
Using Event Properties in Procmon
If you want to get more information about a specific operation from the list, all you need to do is double-click on one event and the following window will appear:
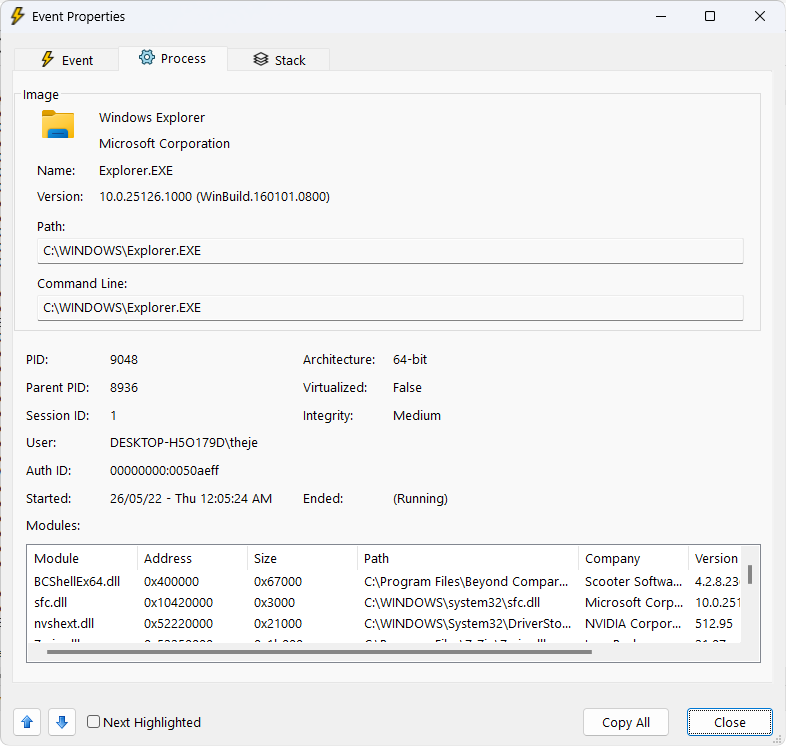
The “Event Properties” window gives you access to all the details available for a specific operation and includes three main tabs:
1. The “Event” tab - where you will see the general event information:
- Thread
- Class
- Operation
- Needed Access, etc..
2. The “Process” tab gives you additional information like:
- Image Version
- Path
- Command line
- Session ID
- User
- Modules, etc.
3. The “Stack” tab shows all the steps that were followed for that particular operation to reach that stage, giving you full details to find out where the operation breaks.
How filtering operations work in Procmon
As you might guess, seeing all the operations makes it quite difficult to debug your particular operation, so Procmon offers a ton of filtering options.
Filter Option in Procmon from the Main window
The first and easiest filter is to present it in the main window. This allows you to show/hide different classes: Registry, FileOperations, Network, Process & Thread Activity, Profiling.
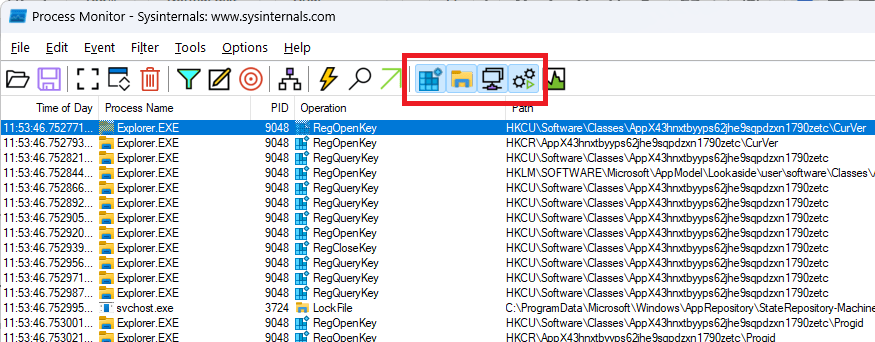
For example, in the next screenshot, you can see that I hid all the operations except the Registry ones:
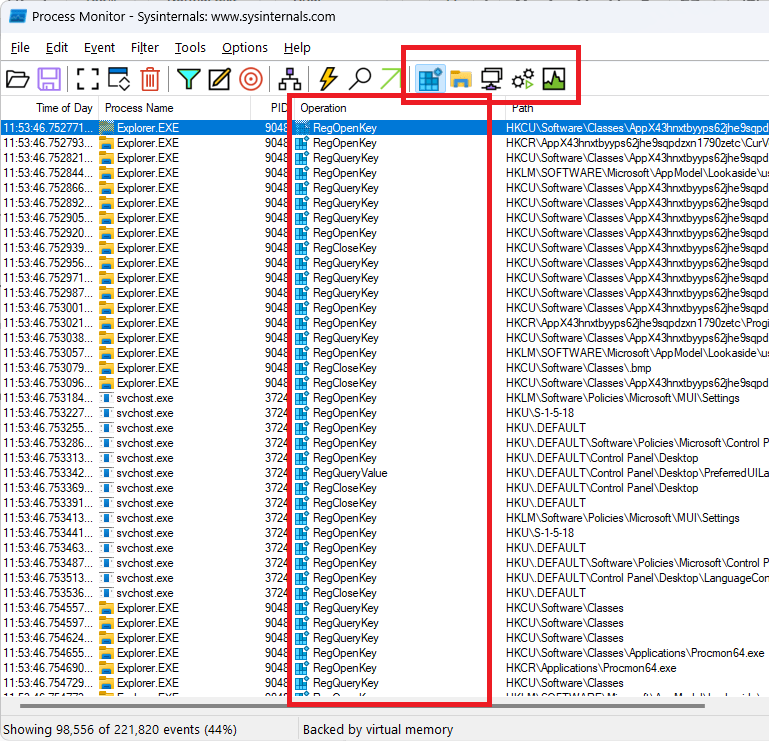
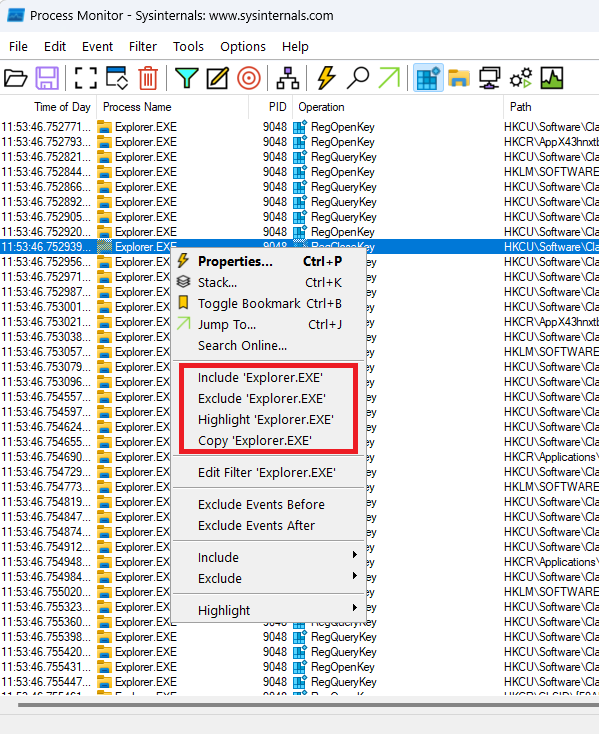
But what if I want to see only Explorer.exe operations on the Registry?
It’s quite easy, and there are two ways of doing it. The first option is to right-click an event that has the Explorer.exe Process Name and click “Highlight”. If you want to remove other processes, you can right-click each one and select “Exclude”:
Filter options in Procmon from the Filter window
The second option is to navigate to Filter > Filter and a new window will appear:
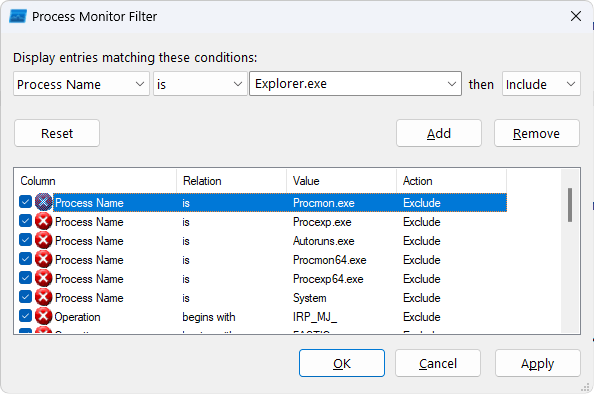
In this window, we can configure to display the entities as follows:
All we have to do is:
- Select Process Name – Explorer.exe,
- Go to Include and click on the “Add” button.
- Then, click OK.
This will ensure that only the Explorer.exe will appear in the capture, and with the registry operations filter, you will now see only what Explorer.exe operations are happening in the registry. Cool right?
Filtering operations is one of the most important and powerful aspects of Procmon. By filtering operations, you can easily detect your issues on your system/application. You can filter anything from Architecture, Authentication ID, Category, Command Line, Company, Completion time, Date & Time to Version.
Another example where filtering is important is when we want to find out if a particular EXE contains an MSI that is extracted and executed during the installation.
We already covered this scenario in the MSI Packaging ebook - Helpful tools chapter, but let’s go quickly through the steps:
Under the drop down menu, hover the Filter > Filter, go to Display entries matching this condition and select Operation is Process Create.
This will track any newly created process on the system, meaning that if you launch an EXE installer and it installs an MSI, it will first need to create the MSI operation which will handle the Windows Installer execution. Pretty neat, huh?
What are the capture options in Procmon?
One important tip when working with Procmon is to never leave the capture running for long, otherwise you will run out of memory. To enable or disable the capture, all you need to do is click the button highlighted below:
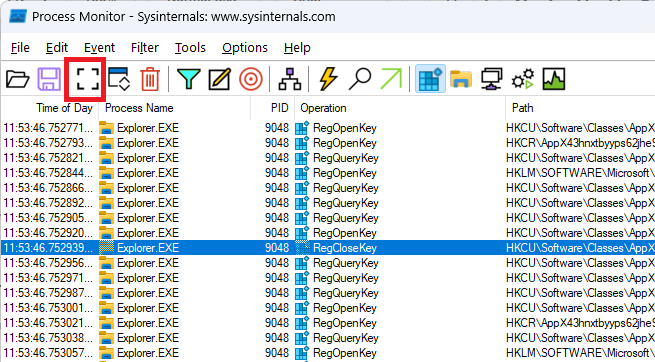
The recommendation would be to stop the capture before you start analyzing your event. This will not only ensure a smaller log and faster filtering times, but it's also good for memory management.
If you want to clear all the information log that Procmon has acquired since the capture has started, you can click the trash bin button:
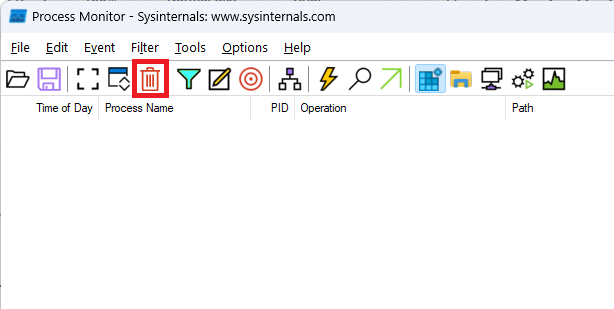
Working with Procmon logs
Let's say that you want a user to do a small capture of events on his machine and then you want to analyze that capture. What are your options?
Procmon offers the possibility to save the event list in a wide variety of formats:
- Native Process Monitor Format (PML)
- Comma-separated values (CSV)
- Extensible Markup Language (XML)
The PML option is the most comprehensive one and the easiest to use with Procmon. However, if you want to debug certain logs in a developer's manner, you can always use the CSV or XML options.
Procmon does not open CSV or XML logs, those logs must be parsed independently.
Saving a “log” is quite easy, once you have the capture done, click on File > Save. This will bring up an additional window where you can specify the type of log you want and the path where it will be saved:
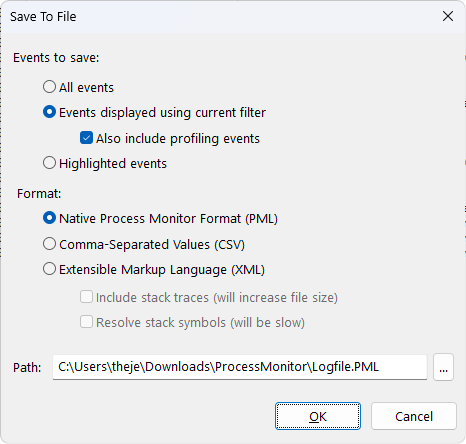
For better compatibility, we exported the PML log. If you want to open a log with Procmon, just click on File > Open and select your file.
Conclusion
To conclude our topic, Process Monitor is one of the most popular and best tools on the market for debugging. While it might be intimidating at first, once you get used to it, you may not want to search for another tool.
Did you find this article helpful? Leave a comment below!
